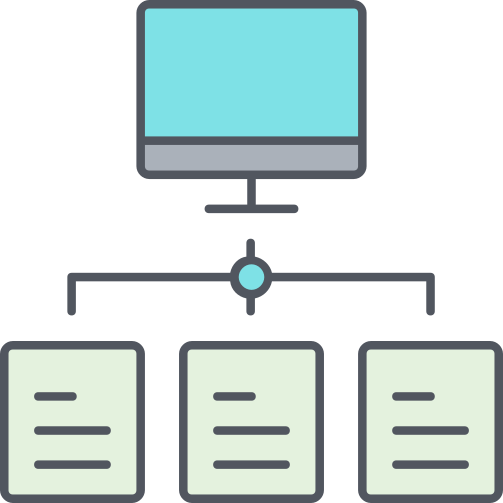
This image presents a comprehensive visualization of network analysis data, showcasing intricate relationships and interactions within a specified dataset. The design incorporates various graphical elements such as nodes and edges, which represent entities and their connections, respectively. The color coding and layout are strategically employed to highlight key insights and patterns, making it easier for analysts to interpret complex information. This visualization is particularly useful for data scientists, network engineers, and business analysts who require a clear understanding of network dynamics for decision-making, troubleshooting, or optimizing performance. It can be utilized in presentations, reports, or dashboards to effectively communicate findings and support strategic planning.

Part of the
Network SVG collection,
in Technology.
Download the Network Analysis Visualization vector as a ready-to-edit .svg file —
it scales to any size without losing quality and can be recoloured in any
vector editor or straight in CSS.