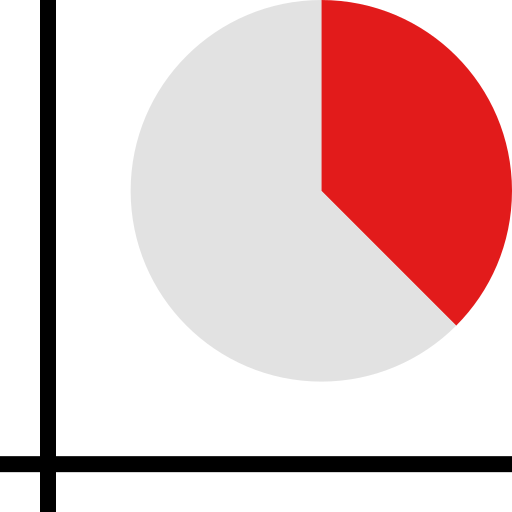
This circular diagram is divided into three distinct sections, each representing a separate area for data visualization or conceptual representation. The design is ideal for illustrating processes, categories, or components that are interconnected yet distinct. Its symmetrical layout allows for easy comprehension and comparison of the three areas, making it suitable for presentations, reports, and dashboards. The clean lines and balanced proportions enhance its aesthetic appeal, ensuring that it captures the viewer's attention while effectively conveying information. This diagram can be utilized in various fields such as business analytics, educational materials, and project management to simplify complex information and facilitate decision-making.


Part of the
Dashboard SVG collection,
in Technology.
Download the Tri-Section Circular Diagram vector as a ready-to-edit .svg file —
it scales to any size without losing quality and can be recoloured in any
vector editor or straight in CSS.